Showing posts with label graph. Show all posts

Monday, February 1, 2010

Vellman K8055 & Activity Graphs


I recently picked up a Vellman K8055 interface board.

My original application was in conjunction with Jonathan, G4KLX's D-Star project. He has since added other methods of support for transmitter control, such as legacy serial port keying.

The Vellman board has 5 digital input channels and 8 digital output channels. In addition, there are two analogue inputs and two analogue outputs with 8 bit resolution. As one can imagine, it has a lot of potential applications.

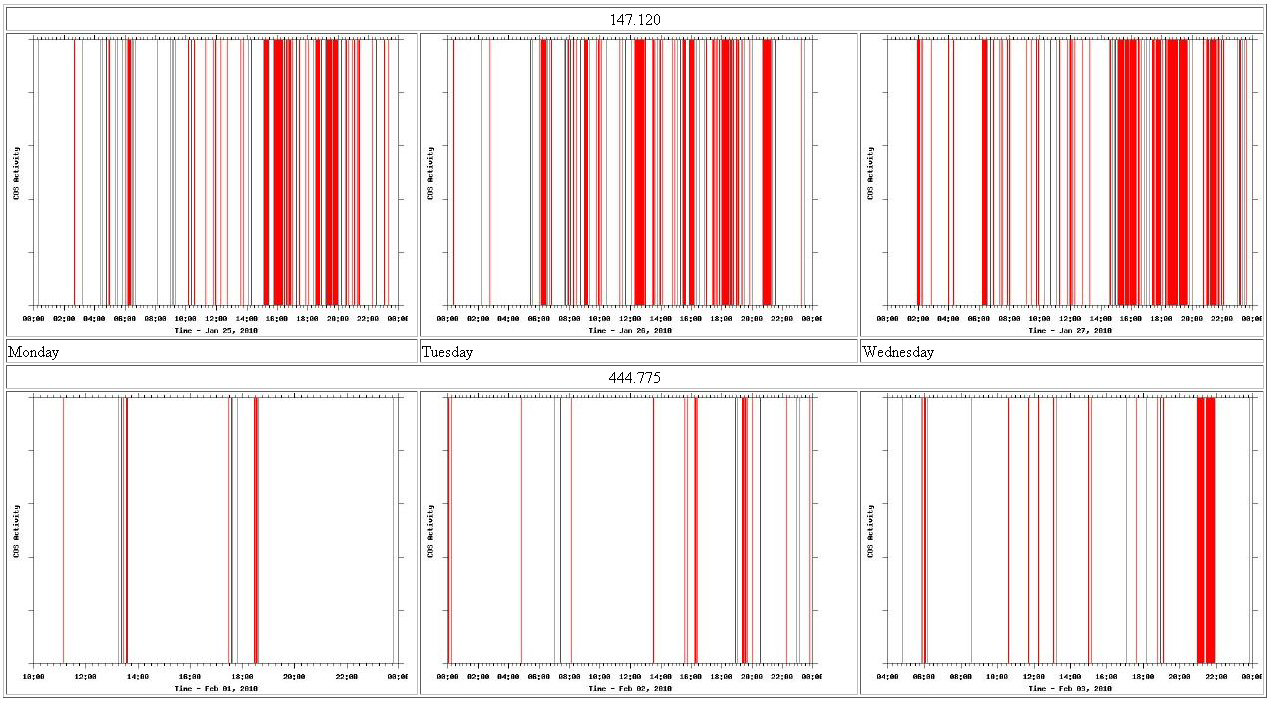
I had a guy interested in my repeater activity graph scripting that I mentioned a few years ago. That was designed around repeaters with IRLP as this would just be a simple add-on for the Linux machine.

So for my first Vellman idea, I whipped up some perl code to watch a COR of a radio and provide the same logging and graphing functionality.

Refer to the original documentation if this interests you. I have updated it.

http://www.qsl.net/kb9mwr/projects/voip/activity-graphs.html

Monday, May 28, 2007

Repeater Activity Graphs


In this piece of documentation, I show how to generate on the fly line graph image files of repeater activity.

http://www.qsl.net/kb9mwr/projects/voip/activity-graphs.html
In this case we assume the repeater has an IRLP computer running the Linux operating system already interfaced to it. The IRLP hardware interface an system binaries already provide us the necessary basic tools. We don't need a basic stamp or PIC interface.

IRLP has a readinput binary for troubleshooting. This reports; cos active, cos inactive, ptt active, ptt inactive, and all dtmf decoded. Since this is always connected to your repeater system you can use it as a data basis to generate a visual graph of system activity using gnuplot, a command line utility. This is handy to identify when the system is most active. You can have the graph export to a club website or just about anything you can think of. I have the file output use the day of week name in it, so you can easily look at weeks worth of data.